Before you commit the budget — know the ceiling, the break-even, and what breaks the plan.
SHADOWS LAB produces a pre-launch simulation report for festival teams. Forecast demand range, revenue, sell-through speed, pricing sensitivity, and the top risks — before lineup commitments lock in and before marketing spend is committed.
- 1Weak undercard pull outside core audience
- 2Price sensitivity above €69
- 3Rival event same weekend
Festival decisions are made before the market has spoken.
Lineups, venues, dates, prices, marketing budgets, and production commitments are often locked before anyone knows how the audience will actually respond. By the time weak demand appears, the expensive decisions have already been made.
Will this lineup sell?
Not just whether it looks strong — whether it can move enough tickets in this city, at this price, on this date.
Are we pricing it right?
A ticket price can protect margin or kill velocity. The right number depends on market size, audience intent, competition, and timing.
What breaks the plan?
The wrong announcement order, weak undercard, rival event, slow sales curve, or crowd-flow pressure can change the entire outcome.
See what you get before you decide.
Every Lab Report includes forecast ranges, a sell-through curve, scenario comparisons, and a prioritized risk list. Here is what a real report looks like.
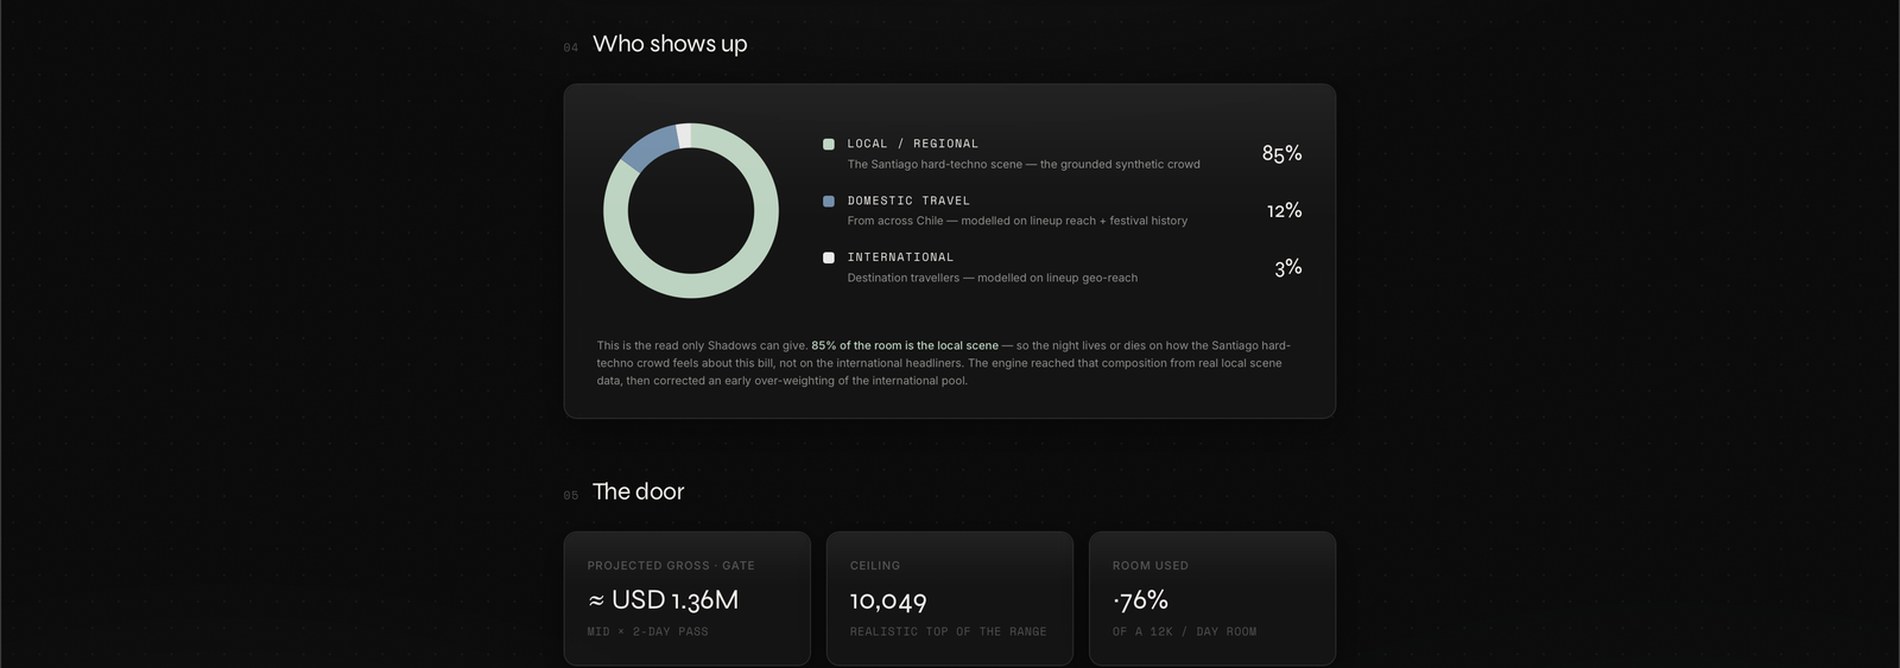
The Core Read — the foundation of every simulation.
Every Lab Report starts with the Core Read. It answers the commercial question every festival team has before launch: how far can this night realistically go?
The Ceiling
How many tickets this lineup, at this price, in this city, can realistically sell.
The Door
Projected gross at the gate, revenue range, and where break-even pressure lands.
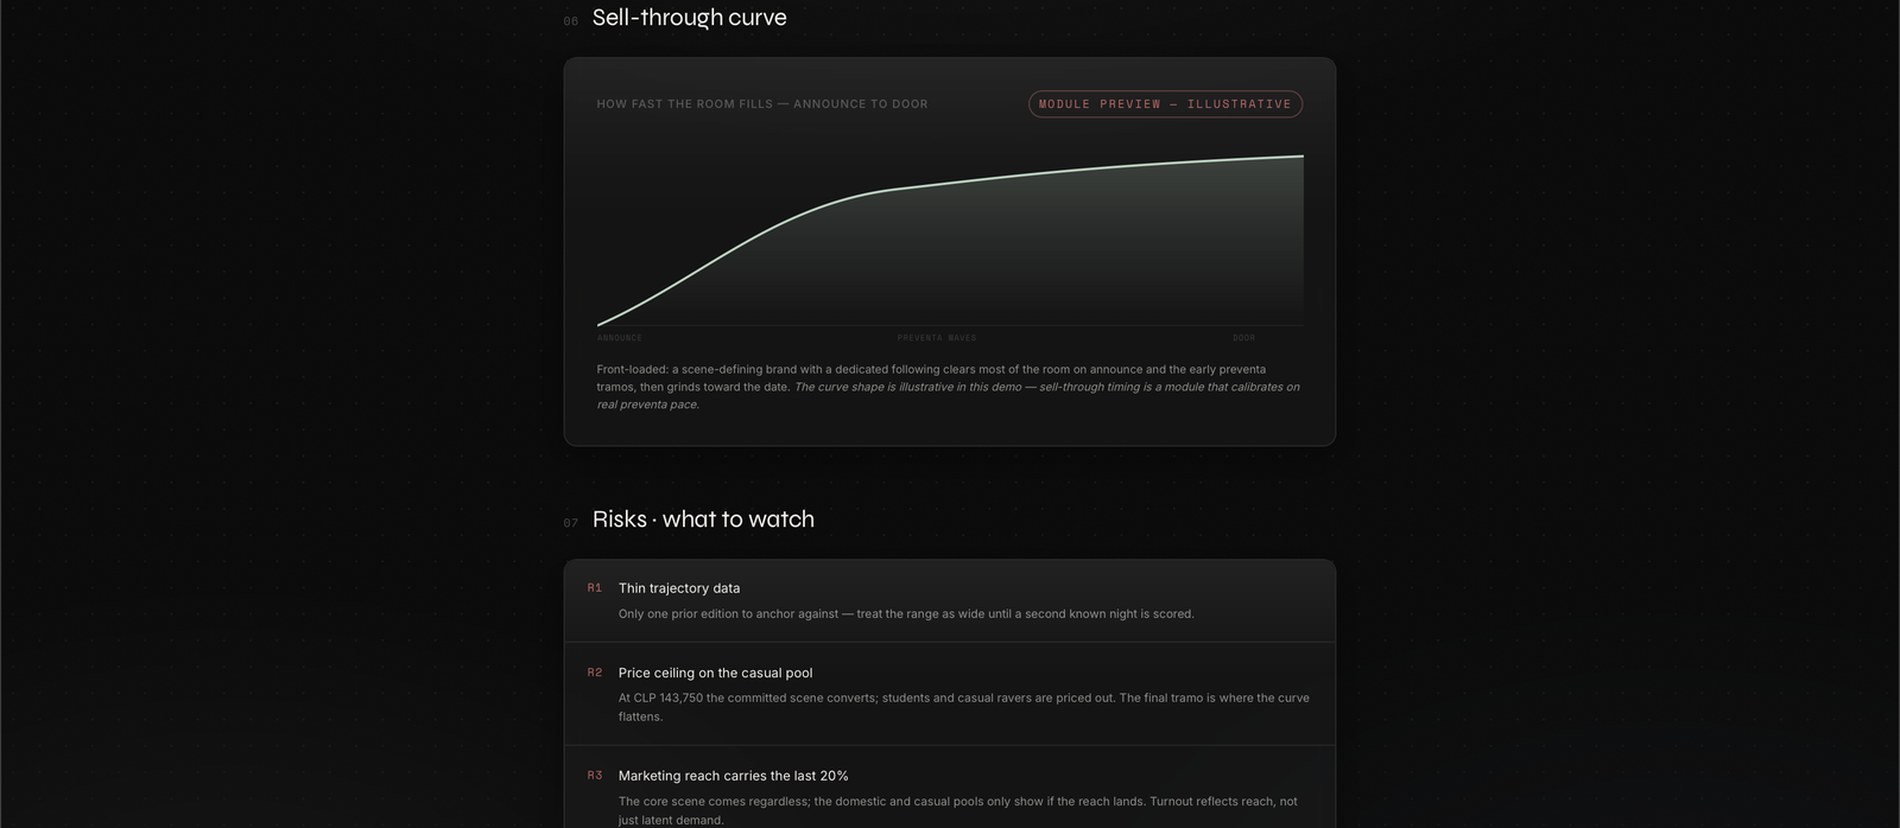
Sell-through Curve
Not just how many tickets — how fast. See whether demand is likely to spike early, grind slowly, or stall.
Confidence + Top Risks
A forecast range, confidence level, and the top three things most likely to break the plan.
Pick the questions keeping you up at night.
Each module tests a specific decision before you commit. Start with the Core Read, then add the modules that matter.
Lineup A vs B vs C
Compare different booking strategies side by side: one mega-headliner, three mid-tier acts, stronger undercard, different closer, or alternate genre mix.
Projected demand, sell-through, gross, risk, and likely ROI difference.
The Pricing Test
Move the ticket price and watch demand, revenue, and sell-through change.
Find the range that protects both margin and velocity.
The Date Test
See how day, season, holidays, weather risk, and competing events affect likely turnout.
Demand impact by date and competition pressure.
The Announce Strategy
Test whether to announce headliner-first, full-lineup, phased release, or undercard-first.
Expected effect on hype, early conversion, and sales curve.
Cannibalization
Model how rival events in the same city, month, or genre may eat into your demand.
Overlap risk, audience leakage, and defensive positioning.
The Concept Read
Test how the event's positioning lands with the market, beyond just the names on the bill.
Concept strength, audience fit, and market clarity.
Marketing Reach
Estimate how marketing spend may translate into awareness, clicks, conversions, and where the curve bends.
Top-of-funnel estimate and spend sensitivity.
This module is calibrated best when past campaign data is available.
What only SHADOWS LAB can add.
Undercard Discovery
Surface emerging acts that can expand your reach without cannibalizing the headliner. We analyse audience overlap, streaming geography, and live history to identify which bookings are likely to pull new segments — not just reinforce the existing crowd.
Principle
We never score a person. We simulate the event-market reaction.
What the simulation is built from.
The Lab Report is not a polished opinion. It is built from public market signals, structured into a quantitative model. Here is what we use and what we do not claim.
Data inputs
What we do not claim
- —We do not predict the future. We model likely ranges based on available signals and structured assumptions.
- —We do not have access to your ticketing platform's internal data unless you share it. Your own historical data improves confidence when available.
- —We do not guarantee sales or attendance. The report is a decision-support tool, not a sales forecast.
- —We do not score or grade artists as individuals. The simulation models market fit for a specific event concept.
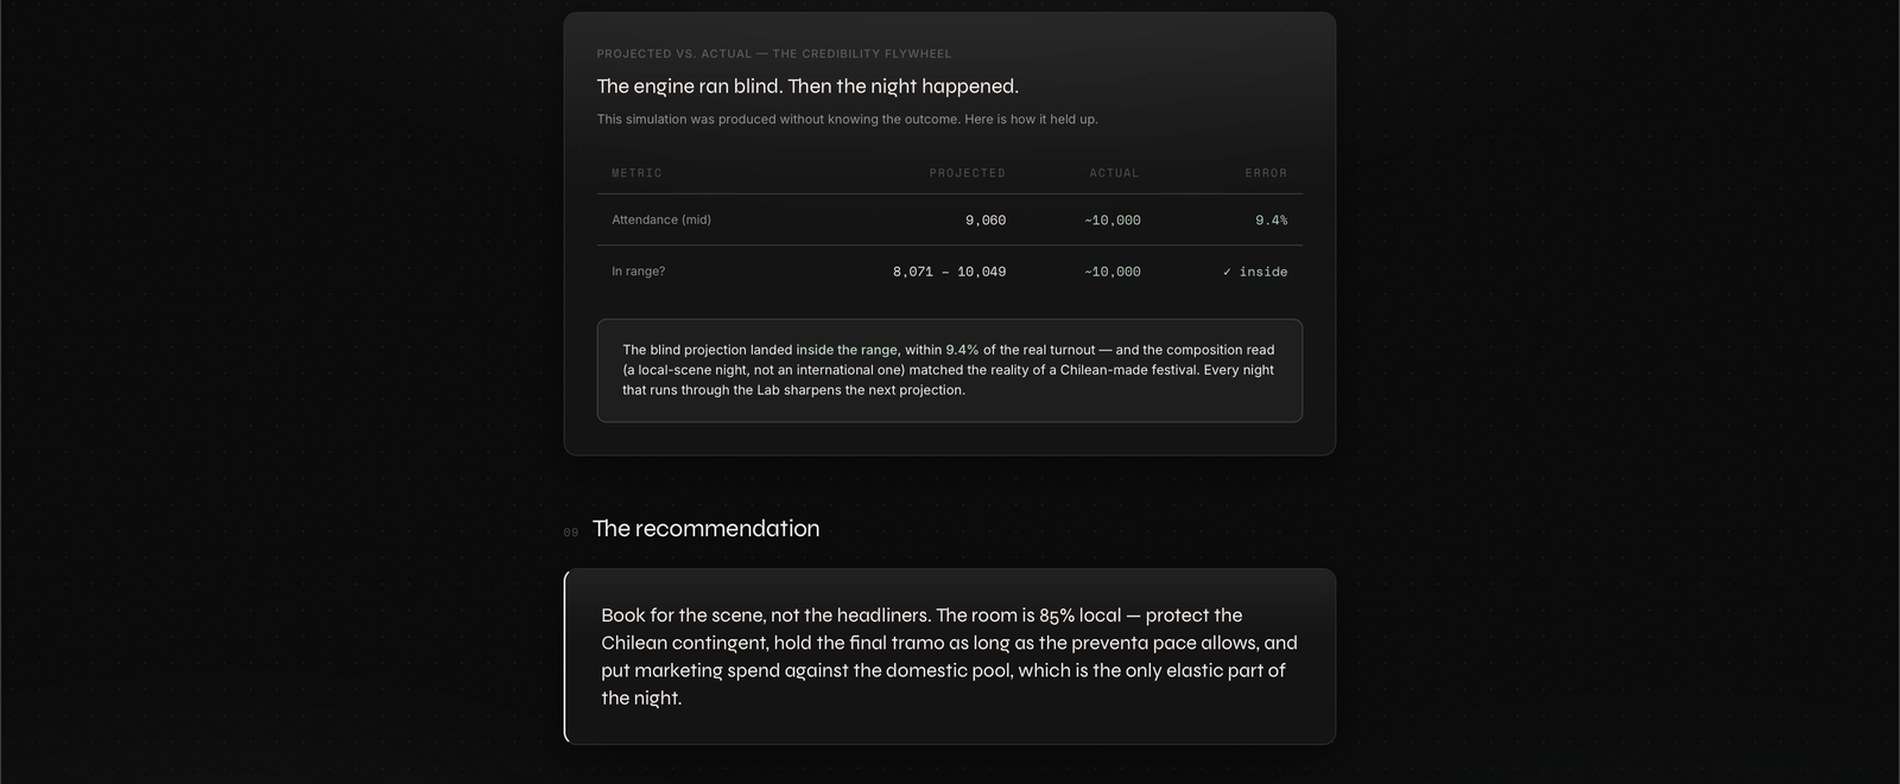
The simulation uses an agent-based model: it builds a synthetic audience for the event's market from public signals, then runs each simulated attendee's decision to buy, wait, or skip based on price, lineup pull, and timing. The case study shown above was generated by that process, blind, before the actual result was known.
How it works.
Choose your questions
Pick the modules that match the decisions you are making: lineup, pricing, date, announce strategy, competition, concept, or marketing spend.
Send the inputs
Share the lineup, city, date, venue, capacity, ticket price, target audience, marketing plan, and any historical sales data you have.
We run the simulation
We build the event-market model, test the scenarios, and calculate likely ranges for demand, revenue, velocity, and risk.
You get the Lab Report
You receive a clear decision report with the forecast range, scenario comparisons, risks, and recommended changes before launch.
Pricing
Every simulation starts with the Core Read. Price is determined by the number of modules, market complexity, and turnaround requirement. No retainer, no subscription — priced per event. Founding-partner pilot slots are limited and by application.
Founding Partner Pilot
By application. A discounted first simulation for selected early festival teams — not a standard tier.
- Core Read
- 2 decision modules
- 1 review call
- Feedback and post-event comparison
The Core Read
The base Lab Report for one event concept. The foundation every simulation starts from.
- Ticket ceiling
- Projected gross
- Break-even pressure
- Sell-through curve
- Confidence range
- Top 3 risks
- 60-minute review call
The Launch Lab
The main package for teams testing lineup, pricing, and launch strategy before final spend.
- Everything in Core Read
- 3 decision modules
- Scenario comparison
- Recommended changes
- 15–25 page Lab Report
- 90-minute review call
Prices are per event. Larger promoter groups, multi-event operators, and ticketing partners can request custom pricing.
Frequently asked.
Book your founding-partner simulation.
Send the basics. We reply within one working day with the right package and what we need to run the first simulation.